
Monday, November 22, 2010
The first rogue wave?
On New Year's day 1995 a huge rogue wave occured at the Draupner Platform (an area in the North Sea off the coast of Norway) and was hence named the Draupner Wave. This wave is certainly not the first rogue wave to occur, but it is the first wave to be measured with instrumentation thus proving the many past anecdotal occurances. The Draupner wave reached a height of over 20 meters.

Friday, November 19, 2010
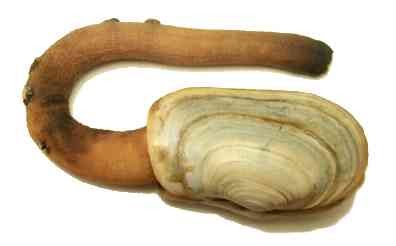
quahogs, cherry stones, and gooey ducks oh my!
Quahog 

Cherry Stones
 Gooey Duck
The first 2 bivalves seem harmless. I'm not so sure about the last one...


Cherry Stones
The first 2 bivalves seem harmless. I'm not so sure about the last one...
Thursday, November 11, 2010
ESI map

This is an ESI map of the coast of Point Reeves, California. This map focuses on various different species of seals and their corresponding habitats.
Saturday, October 23, 2010
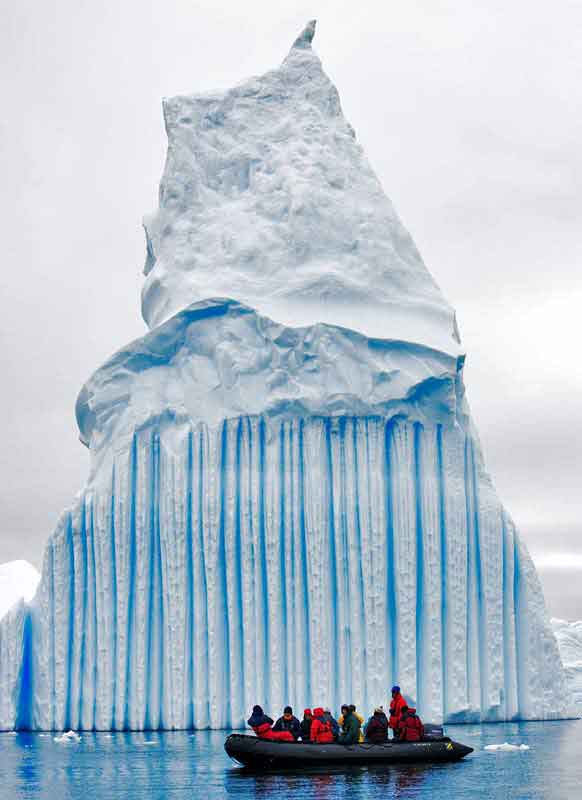
Icebergs and Glaciers
About 75 % of all the world's freshwater is stored as ice. After the oceans, the single greatest body of water is the Antarctic ice sheet.
A glacier is any large mass of snow or ice that persists on land for many years. Glaciers form in areas where more snow falls than melts. As this snow accumulates it compresses into thick, dense, solid ice. Glaciers actually move because their own weights causes a type of melting to occur, allowing movement —downhill if on a slope or in all directions from the center if on a flat surface.
North Polar ice cap:

South Polar ice cap:

Iceberg:

Iceberg video:
A video that contains an overview of the cryosphere and the movement/ seasonal retreats of glaciers
Wednesday, September 22, 2010
URLs
Cycling of DDT in the Environment
The long range transport of persistent and semi-volatile organics was studied in this article using a coupled atm-ocean circulation model. DDT was found mostly in soils and had the longest residence time in the soil and ocean. DDT travels vertically in oceans by attaching to particles and suspending downward. About 30% of DDT is stored in particulate matter in the oceans. The global scale substance transport in the environment is ultimtely determined by atmospheric circulation. After a decade of simulation 12% of global DDT was found to accumulate in the Arctic.


http://web.ebscohost.com/ehost/detail?vid=3&hid=10&sid=ef1c4dca-6aaa-42ce-bd7a-9ad82667cc61%40sessionmgr11&bdata=JnNpdGU9ZWhvc3QtbGl2ZQ%3d%3d#db=a9h&AN=43893812#db=a9h&AN=43893812
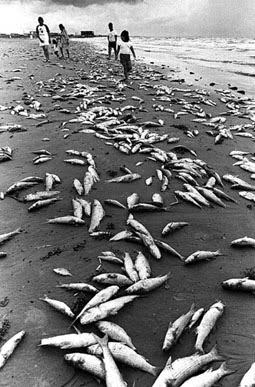
ER admissions and the Red Tide
This article deals with the relevancy of emergency room admissions for gastrointestinal issues to Florida Red Tide Blooms. Exposure to Red Tide aerosols has been known to cause neurological as well as respiratory illnesses, but it can also cause gastrointestinal complications due to ingestion of shellfish and fish. During Florida Red Tide blooms, ERs saw a 40% increase in admissions for gastrointestinal illness.


The long range transport of persistent and semi-volatile organics was studied in this article using a coupled atm-ocean circulation model. DDT was found mostly in soils and had the longest residence time in the soil and ocean. DDT travels vertically in oceans by attaching to particles and suspending downward. About 30% of DDT is stored in particulate matter in the oceans. The global scale substance transport in the environment is ultimtely determined by atmospheric circulation. After a decade of simulation 12% of global DDT was found to accumulate in the Arctic.


http://web.ebscohost.com/ehost/detail?vid=3&hid=10&sid=ef1c4dca-6aaa-42ce-bd7a-9ad82667cc61%40sessionmgr11&bdata=JnNpdGU9ZWhvc3QtbGl2ZQ%3d%3d#db=a9h&AN=43893812#db=a9h&AN=43893812
ER admissions and the Red Tide
This article deals with the relevancy of emergency room admissions for gastrointestinal issues to Florida Red Tide Blooms. Exposure to Red Tide aerosols has been known to cause neurological as well as respiratory illnesses, but it can also cause gastrointestinal complications due to ingestion of shellfish and fish. During Florida Red Tide blooms, ERs saw a 40% increase in admissions for gastrointestinal illness.

Chinook Salmon Growth during the 1998 El Nino and 1999 La Nina
The following article researches the growth rate of juvenile Chinook Salmon during El Nino and La Nina periods. The salmon experienced greater growth during strong El Nino events as opposed to the La Nina event. This was due to elevated temperatures, lower salinity, and greater freshwater outflow.


Monday, August 30, 2010
Shark Ray Alley

These Nurse Sharks are swimming in Shark Ray Alley, my favorite snorkeling sight we visted for Coral Reef Ecology. When you're swimming there's always nurse sharks or Souther Stingrays bumping into you:)
The Blue Hole- Belize

This is the Blue Hole located in Belize which is where I traveled 2 years ago for a coral reef ecology class. We didn't get to travel to this particular reef (lighthouse reef) but it is a very interesting place.
Monday, May 3, 2010


These maps provide a visualization of water sampling points in the Florida Everglades. These samples were taken by Dr. Brian E. Rood in 1992 as a requirement to obtain his Ph.D. The sampling points were taken at different depths to assess whether or not soil depth is a variable for varying mercury concentrations.
Thursday, March 18, 2010

Thursday, February 25, 2010

Tuesday, February 23, 2010

Tuesday, February 9, 2010


Thursday, February 4, 2010
Geocaching

There are 24 geocaching sites within 5 miles of where i live.
Geocaching is a high-tech treasure hunting game played throughout the world by adventure seekers equipped with GPS devices. The basic idea is to locate hidden containers, called geocaches, outdoors and then share your experiences online. Geocaching is enjoyed by people from all age groups, with a strong sense of community and support for the environment.
Tuesday, February 2, 2010

Thursday, January 21, 2010
One acheivement in cartography of each:
John Paul Goode- created the Goode’s School Atlas which was later renamed Goode's World atlas and was published by Rand McNally in 1923.
Erwin Raisz- created a collection of hand-drawn maps while at the Institute of Geographical Exploration at Harvard University. His pen and ink methods were replacing photo-mechanical processes and scribing. In 1938, he published the first cartography text called General Cartography.
George Jenks-From 1886-1889 Jenks served as United States Solicitor General, during President Cleveland’s first term.
Waldo Tobler-Dr. Tobler was one of the main investigators and a Scientist who worked for the National Center for Geographic Information and Analysis.He formulated the "first law of geography" in 1970 while working on a project, and is the first person to innovate unusual map projections.

today's quiz
What are the skills necessary to be a good cartographer?
A good cartographer needs to be conversant in GIS applications. It is important to be able to understand how to use these applications (ARCGIS, ARCVIEW, etc.) so you can successfully layer graphs, add titles, symbols, and other pieces to make a good, readable graph.
Distinguish between the elements of a good map vs. a bad map.
A good map is easy to read. Someone who is not familiar with the subject matter should be able to look at a well done graph and understand the information that has been added to it. By being able to understand the bits of information, the person should also be able to understand the whole scope to the research, project, etc.
A bad map, however, typically lacks order. Various elements may be scattered around the map in an unorganized, undecipherable way. Bad maps typically lack legends, scales, titles, pop-ups, and other elements that make a good map. Bad maps may also have a very bad color which is displeasing to the viewer. If the iconic image is bad, the map is typically also bad.
Subscribe to:
Posts (Atom)